writing
← all postsTracing Tanstack Start applications with Better Stack
Modern web apps are distributed systems, even when they look simple on the surface. When a single user action fans out into server functions, database calls, and third‑party APIs, you need end‑to‑end visibility to understand where time is spent and why errors occur. That's exactly what tracing provides.
Modern web apps are distributed systems, even when they look simple on the surface. When a single user action fans out into server functions, database calls, and third‑party APIs, you need end‑to‑end visibility to understand where time is spent and why errors occur. That's exactly what tracing provides.
In this post we'll add tracing to a TanStack Start application using OpenTelemetry and export those traces to Better Stack via OTLP. We'll keep the scope intentionally tight: this guide focuses only on tracing. No metrics, no logs—just high‑signal spans that tell the story of each request from start to finish.
Instrumentation
We first need to install the OpenTelemetry dependencies.
bun add @opentelemetry/sdk-node @opentelemetry/api @opentelemetry/sdk-trace-nodeNext, create an instrumentation.ts file where we'll configure the OpenTelemetry SDK. To begin with we'll use the ConsoleSpanExporter. The ConsoleSpanExporter outputs trace data to the console, allowing you to verify that tracing is working correctly before configuring the OTLP exporter that will send the spans to Better Stack.
// src/instrumentation.ts

import { NodeSDK } from "@opentelemetry/sdk-node";
import { ConsoleSpanExporter } from "@opentelemetry/sdk-trace-node";

const sdk = new NodeSDK({
	serviceName: "example",
	traceExporter: new ConsoleSpanExporter(), // Temporary
});

sdk.start();
With the SDK ready, ensure it runs before any application code that you care to trace. Import instrumentation.ts at the very top of your TanStack Start server entry so the tracer is active before routes and server functions load.
// src/server.ts

import handler from "@tanstack/react-start/server-entry";

import "./instrumentation";

export default {
	fetch(request: Request) {
		return handler.fetch(request);
	},
};
Finally, we can add spans to our server functions. Later on we'll configure global middleware to automatically instrument requests and server functions.
// src/routes/example.tsx

import { trace } from "@opentelemetry/api";
import { createFileRoute } from "@tanstack/react-router";
import { createServerFn } from "@tanstack/react-start";

const tracer = trace.getTracer("example");

const testFn = createServerFn({ method: "GET" }).handler(() => {
	return tracer.startActiveSpan("testFn", async (span) => {
		try {
			return "Hello World";
		} catch (error) {
			span.recordException(error);
			throw error;
		} finally {
			span.end();
		}
	});
});

export const Route = createFileRoute("/example")({
	component: RouteComponent,
	loader: () => ({
		data: testFn(),
	}),
});

function RouteComponent() {
	const { data } = Route.useLoaderData();

    return <div>{data}</div>;
}
Better Stack
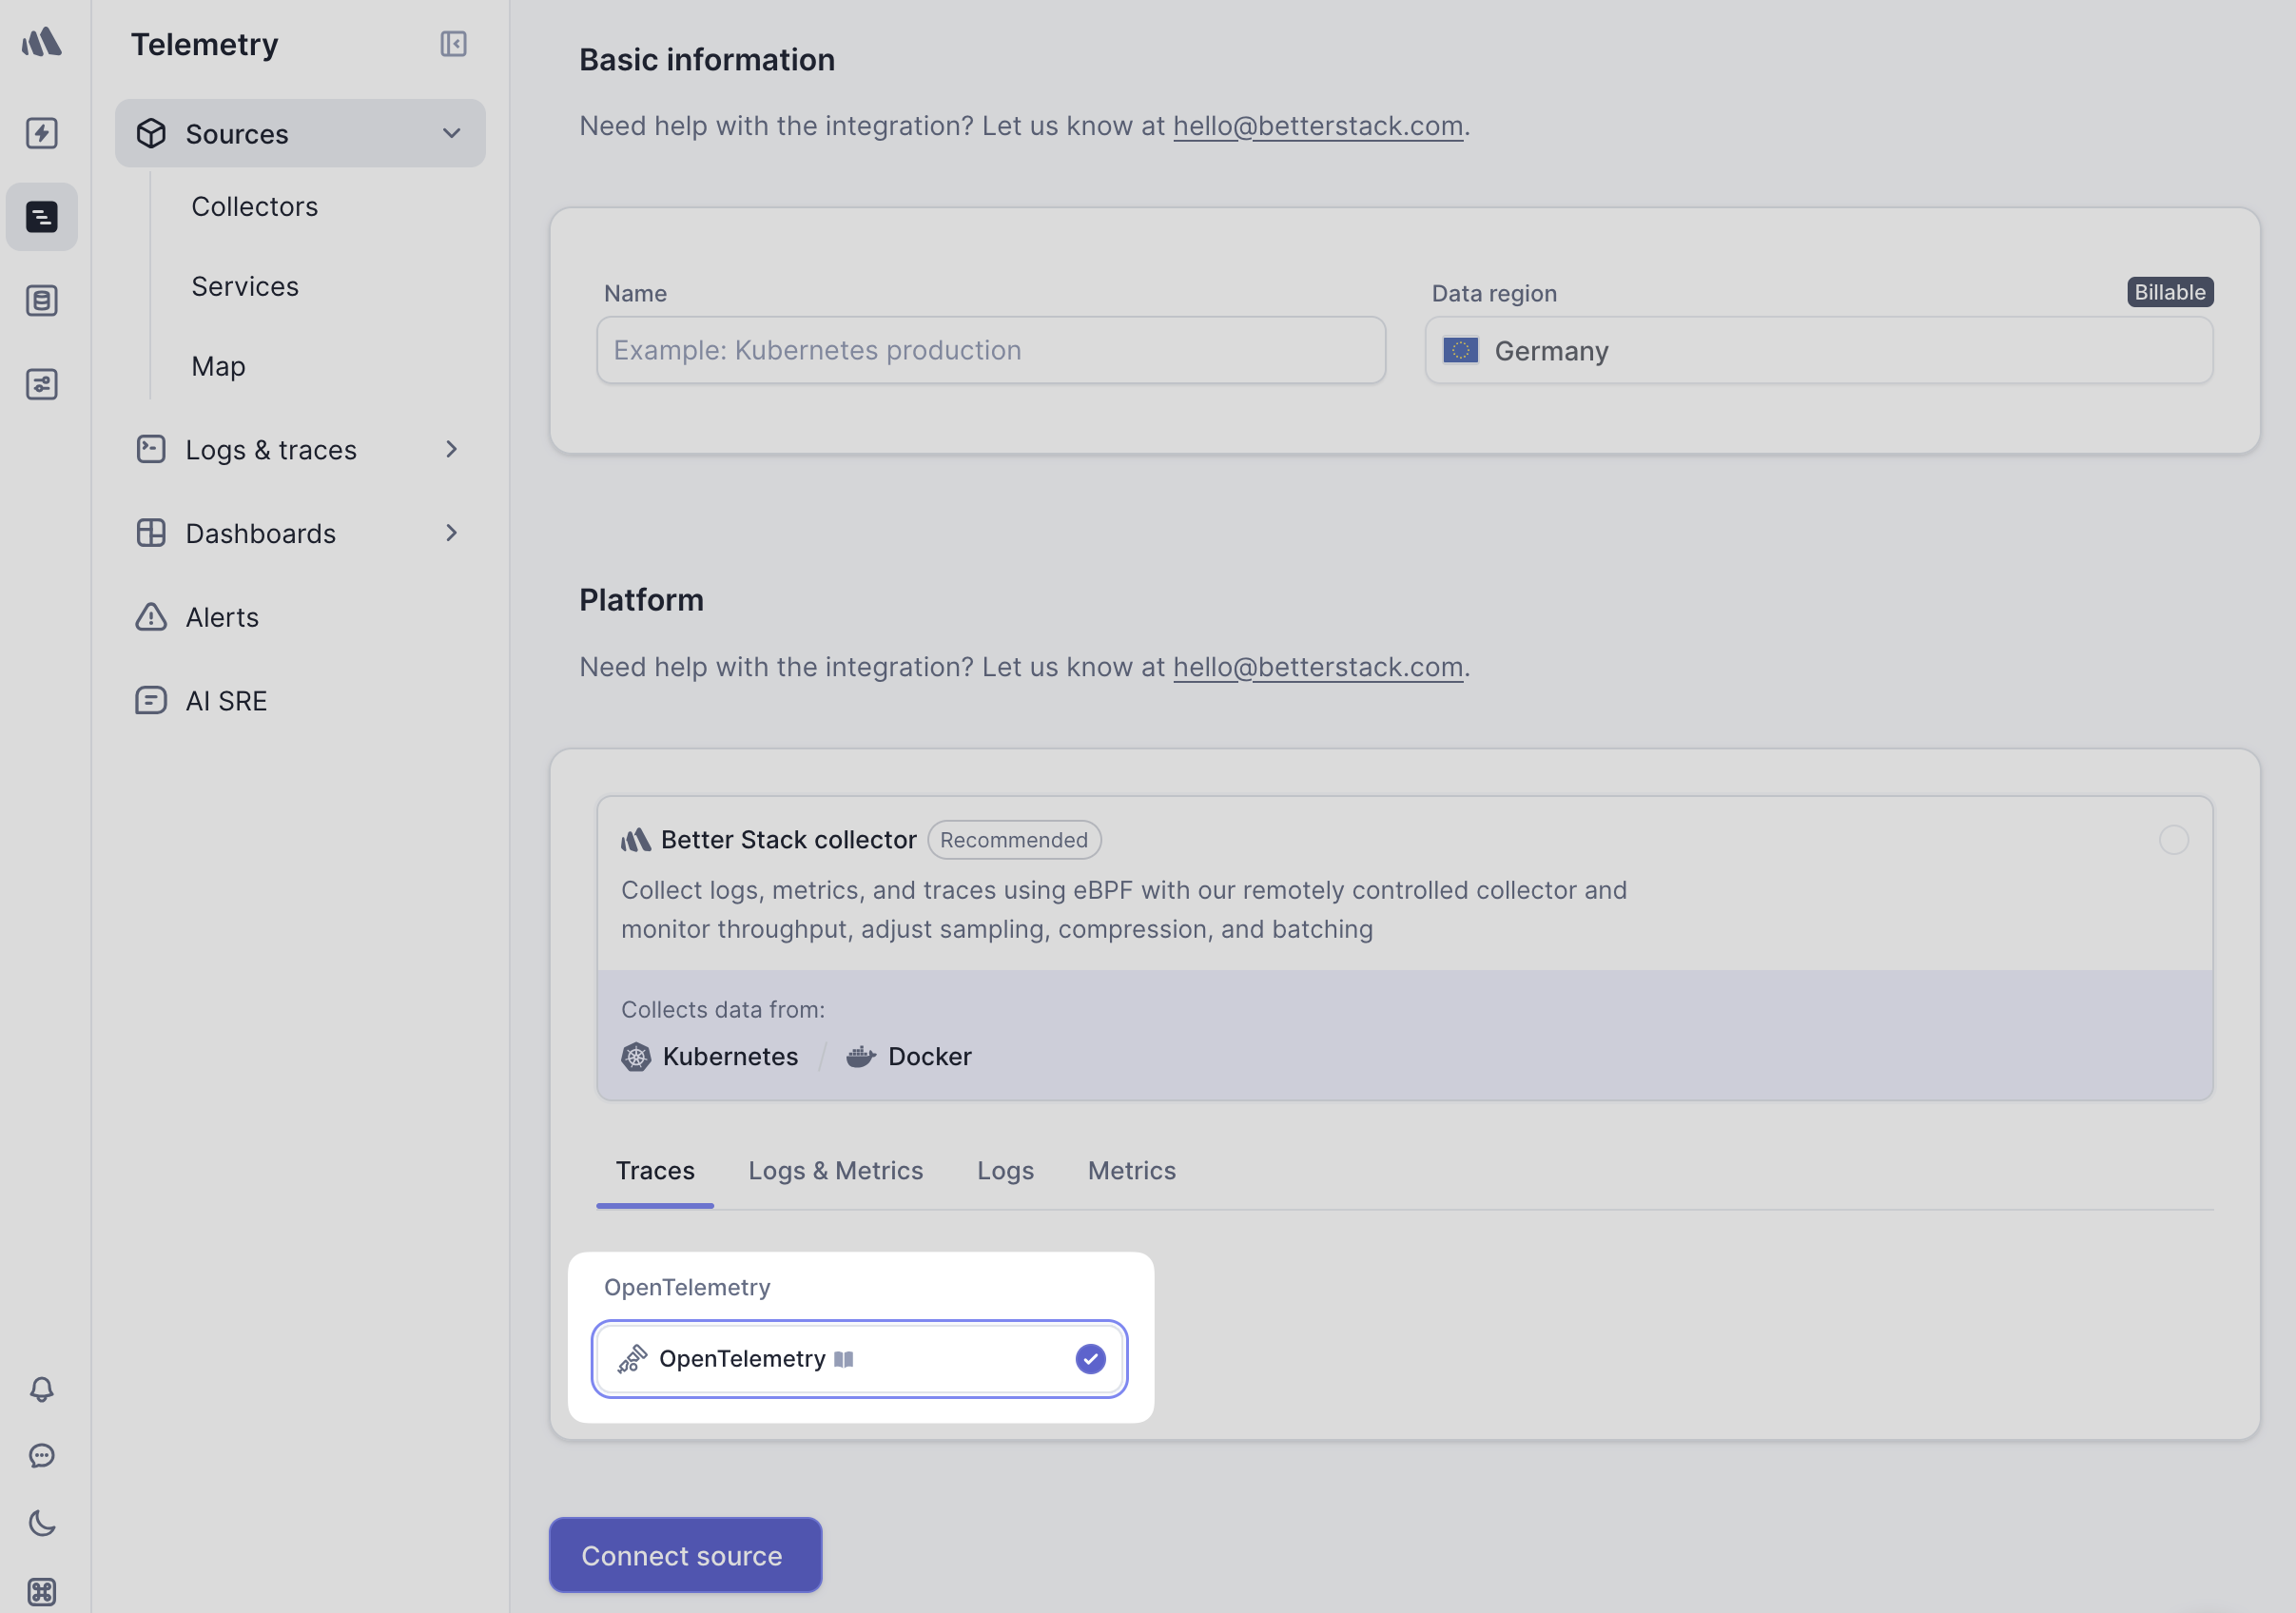
In Better Stack, navigate to the 'Sources' section and connect a new traces source for your application. Ensure that you select the 'OpenTelemetry' platform as the source type, as this will allow you to send trace data using the OTLP protocol.
Next, install @opentelemetry/exporter-trace-otlp-proto and replace the ConsoleSpanExporter with the OTLPTraceExporter in our instrumentation.ts file.
import { OTLPTraceExporter } from "@opentelemetry/exporter-trace-otlp-proto";
import { NodeSDK } from "@opentelemetry/sdk-node";
import { env } from "./env";

const sdk = new NodeSDK({
	serviceName: "example",
	traceExporter: new OTLPTraceExporter({
		url: env.BETTERSTACK_TRACE_URL, // https://<ingesting-host>/v1/traces
		headers: {
			Authorization: `Bearer ${env.BETTERSTACK_SOURCE_TOKEN}`, // <source-token>
		},
	}),
});

sdk.start();
Now you should be able to run your application and see traces populated from the Better Stack dashboard.
Global Middleware
We can configure global middleware to automatically instrument requests and server functions. To do so we need to update the start.ts file like so:
// src/start.ts
import { SpanStatusCode, trace } from "@opentelemetry/api";
import { createMiddleware, createStart } from "@tanstack/react-start";

const tracer = trace.getTracer("example");

const tracing = createMiddleware().server(async ({ next, request }) => {
	return tracer.startActiveSpan(
		`${request.method} ${url.pathname}`,
		async (span) => {
			span.setAttributes({
				"http.method": request.method,
				"http.route": url.pathname,
			});

			try {
				const response = await next();
				span.setStatus({ code: SpanStatusCode.OK });
				return response;
			} catch (error) {
				span.recordException(error);
				span.setStatus({
					code: SpanStatusCode.ERROR,
					message: error.message,
				});
				throw error;
			} finally {
				span.end();
			}
		},
	);
});

export const startInstance = createStart(() => {
	return {
		requestMiddleware: [tracing],
		functionMiddleware: [tracing],
	};
});
Server Function Names
In production TanStack Start uses a hash as the server function name. This can make it difficult to identify the function in the Better Stack UI.
By default, IDs are SHA256 hashes of the same seed to keep bundles compact and avoid leaking file paths.
We can configure TanStack to produce more descriptive function names. Be careful as this API is still experimental.
// vite.config.ts
import { tanstackStart } from "@tanstack/react-start/plugin/vite";
import viteReact from "@vitejs/plugin-react";
import { defineConfig } from "vite";
import tsConfigPaths from "vite-tsconfig-paths";

export default defineConfig({
	server: {
		port: 3000,
	},
	plugins: [
		tsConfigPaths(),
		tanstackStart({
			serverFns: {
				generateFunctionId: ({ functionName }) => {
                    // Configure the function IDs to be something more descriptive
					return `${functionName}`;
				},
			},
		}),
		viteReact(),
	],
});
Next Steps
This guide has shown you how to add tracing to a TanStack Start application using OpenTelemetry and export those traces to Better Stack. We've also configured global middleware to automatically instrument requests and server functions.
The implementation is very minimal and you'll likely want to add more spans and attributes to your server functions. You can also add metrics and logs to your application to get a more complete picture of your application's performance.